Custom Munin Graphs
Munin graphs are often too ugly to show off on public-facing pages, and while the control panel is usually enough to get bare information from graphs, customizing these to become interactive and fancy may prove to be quite a task.
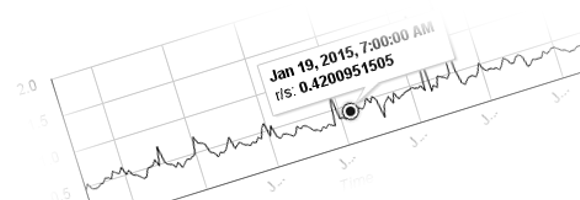
I’m going to use Google Charts to output the number of requests per second my server is processing (the data is a snapshot and does not change in this case). Fortunately, all data collected by the Munin master is stored in RRD format and can be retrieved simply by using the rrdtool fetch command, or by using the PHP RRD library if you’re using PHP, or python-rrdtool if you’re using Python.

