
Xdebug Profiling WordPress Actions and Filters
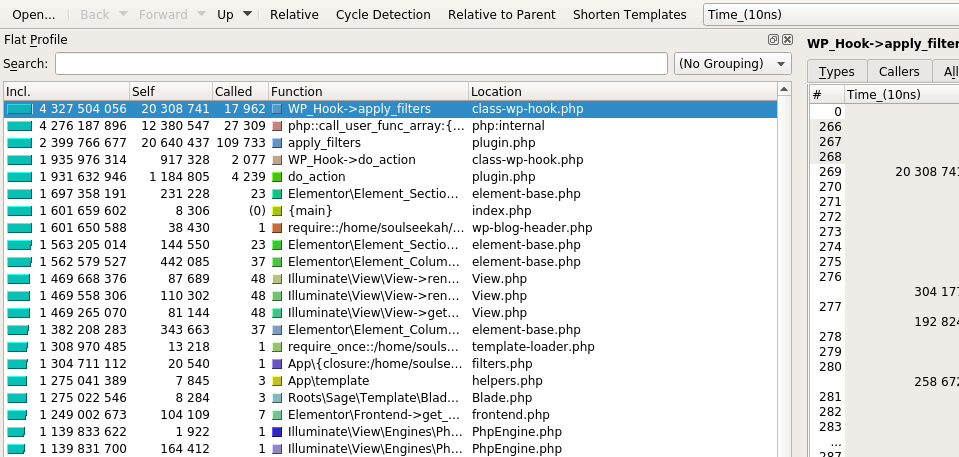
Xdebug is a great profiling tool for PHP code, but it has one little drawback in WordPress that results in a profiling nightmare – WP_Hook::apply_filters. The profiler lumps together all calls to WordPress actions and filters without distinguishing them as different execution paths. This is bad and not useful at all, resulting in a tangled mess of cycles.
diff -u src/base/base.c /tmp/base.c
--- src/base/base.c	2021-04-08 13:34:41.000000000 +0300
+++ patch/base.c	2021-08-27 20:35:46.191578814 +0300
@@ -225,6 +225,29 @@
 		if (edata->func->common.function_name) {
 			if (edata->func->common.fn_flags & ZEND_ACC_CLOSURE) {
 				tmp->function = xdebug_wrap_closure_location_around_function_name(&edata->func->op_array, STR_NAME_VAL(edata->func->common.function_name));
+			} else if (tmp->type == XFUNC_MEMBER && strcmp(edata->func->common.function_name->val, "apply_filters") == 0 && strcmp(edata->func->common.scope->name->val, "WP_Hook") == 0 ) {
+				zval *tag, *current_filter;
+
+				current_filter = zend_hash_str_find(&EG(symbol_table), "wp_current_filter", 17);
+
+				if (NULL == current_filter) {
+					goto normal_after_all;
+				}
+
+				if (Z_TYPE_P(current_filter) == IS_INDIRECT) {
+					current_filter = Z_INDIRECT_P(current_filter);
+				}
+
+				ZVAL_DEREF(current_filter);
+
+				if (Z_TYPE_P(current_filter) != IS_ARRAY || (tag = zend_hash_get_current_data(Z_ARRVAL_P(current_filter))) == NULL || Z_TYPE_P(tag) != IS_STRING) {
+					goto normal_after_all;
+				}
+
+				tmp->function = xdebug_sprintf(
+					"apply_filters{%s}",
+					Z_STRVAL_P(tag)
+				);
 			} else if (strncmp(edata->func->common.function_name->val, "call_user_func", 14) == 0) {
 				zend_string *fname = NULL;
 				int          lineno = 0;
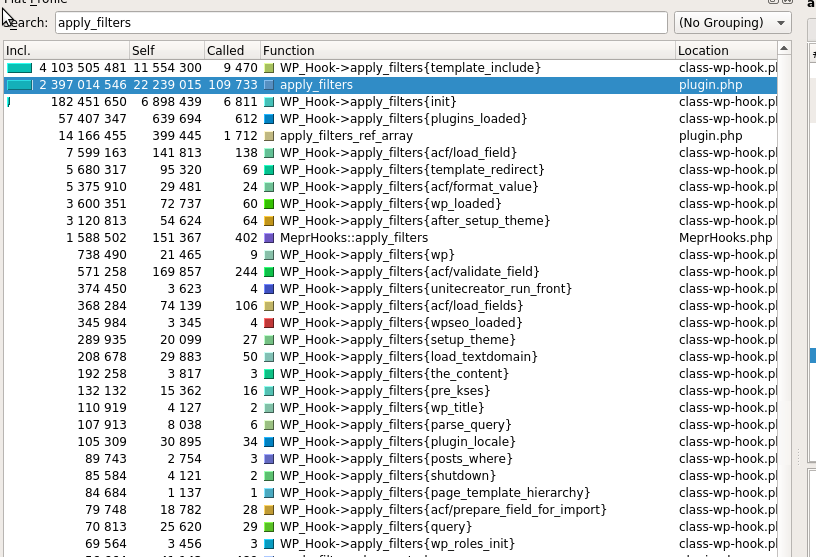
The result is a nice breakdown and cycle untangling:
Very similar code can be used with XHProf which helps as well. Too bad Xdebug has no PHP API to augment the current stack on exit, something like xdebug_profile_override_function( "apply_filters{$wp_current_filter}" );.